Why “day-one observability” matters in AI-generated app builds
AI-generated React + Supabase apps can go from idea to working prototype in minutes. The problem is that production failures still happen at human speed: a single missing index, a noisy edge case in auth, or a slow third-party call can degrade UX immediately. “Day-one observability” means your first deploy already emits traces, logs, and metrics that answer three practical questions:
- What broke? (errors with enough context to reproduce)
- What’s slow? (end-to-end latency with database and network segments)
- How bad is it? (error budgets and SLOs that match user impact)
That mindset is especially important when your codebase is evolving quickly through prompts, UI edits, and iterative refactors. Tools are only useful if the instrumentation survives those iterations and stays easy to reason about.
A practical baseline for tracing React to Supabase
In a typical React + Supabase architecture, the user action starts in the browser, flows through your server/API layer (if you have one), and then into Postgres through Supabase. To make this observable end-to-end, you want one trace that captures:
- Frontend span: route change, user interaction, and fetch call timing.
- Backend span: request handling, auth checks, and business logic.
- Database spans: query timings and (when possible) query labels/metadata.
OpenTelemetry (OTel) is the standard way to do this. It’s vendor-neutral, and it’s compatible with most collectors and backends. The key choice is where your “trace context” is created and propagated. For many apps, you’ll generate or continue a trace in the browser, pass trace headers to your API, and ensure the API layer propagates them to downstream calls.
Keep instrumentation stable under rapid iteration
AI-assisted development can introduce frequent structural changes—new endpoints, renamed components, reworked data flows. Treat instrumentation like an API contract: define a small set of stable span names and attributes you won’t casually rename. Examples:
ui.route_changewith attributesrouteanduser_id_hashapi.requestwithroute,method,status_codedb.querywithdb.operation,db.table,duration_ms
When spans are consistent, your dashboards and alerts don’t break every time the app’s structure changes.
OpenTelemetry tracing patterns that work in the real world
Most teams get stuck not on “how to enable OTel,” but on “what to record so it’s actionable.” A reliable pattern is:
- Start with latency and error context rather than trying to capture everything.
- Add semantic attributes that help you filter by tenant, workspace, or feature flag.
- Minimize cardinality risks by hashing user identifiers and avoiding raw emails, full URLs with IDs, or unbounded strings.
For AI-generated apps, also be explicit about what constitutes a “unit of work.” If the app’s core value is “generate a thing,” capture one top-level span that measures time-to-result and tags whether the output was accepted, retried, or failed validation.
Don’t confuse logs with traces
Logs remain valuable for detailed debugging, but traces are how you understand system shape. Put the “what happened” in traces (with IDs and timing), and keep “why” details in logs, linked via trace IDs. That discipline prevents your logs from becoming the only place where context exists.
Postgres query insights in Supabase without guesswork
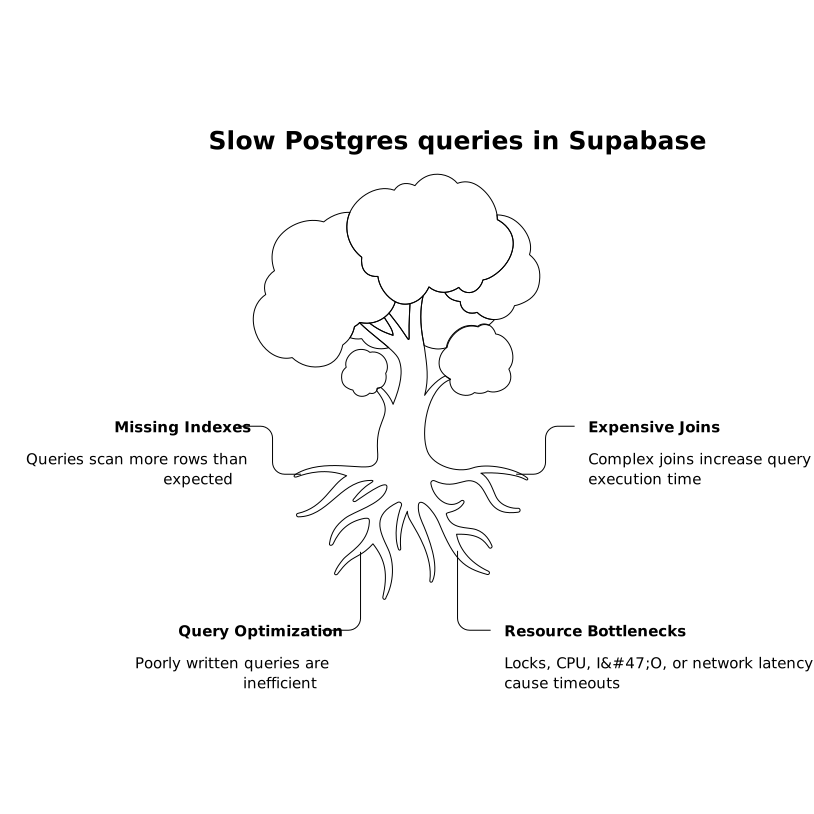
When a React + Supabase app gets slow, it’s often the database: missing indexes, expensive joins, or an innocently written query that scans far more rows than expected. “Query insights” should help you quickly answer:
- Which endpoints correlate with slow queries?
- Which tables are hot, and which queries are getting worse over time?
- Are timeouts caused by locks, CPU, I/O, or network latency?
At minimum, you want query duration visibility and the ability to pivot by operation (SELECT/INSERT/UPDATE), table, and endpoint. When you can, add explain-plan analysis during investigations (not on every request). Even better: standardize a small set of “known expensive” queries and track them as first-class metrics.
Map queries to product features
“Slow query” is rarely the root cause a PM can act on. “The calendar availability search is slow for large venues” is. Tag spans and metrics with feature identifiers (e.g., feature=availability_search) so you can connect Postgres tuning to user-visible impact.
Error budgets that match how users feel the app
Error budgets make reliability concrete. Instead of treating every error as equally urgent, you define an SLO (service level objective), then decide how much failure is acceptable over a window. A practical starting point for many SaaS-style apps is:
- Availability SLO: % of successful requests for core endpoints
- Latency SLO: p95 or p99 response time for the same endpoints
- User journey SLO: success rate of a critical flow (signup, checkout, “create project”)
Once you have an error budget, you can make better tradeoffs during fast iteration: if the budget is healthy, ship; if it’s burning, slow down feature work and fix reliability regressions. This is especially relevant in AI-assisted development where velocity is high and “small changes” are frequent.
Alert on burn rate, not raw error counts
Raw error counts create noise and encourage alert fatigue. Burn-rate alerts tell you whether you’re consuming the error budget too quickly and whether the issue is urgent. Combine a fast-burn alert (catch incidents quickly) with a slow-burn alert (catch chronic degradation).
Operational guardrails for AI-generated codebases
Observability isn’t only instrumentation; it’s also hygiene that keeps data trustworthy. Three guardrails that pay off early:
- PII boundaries: define what must never enter logs/traces (emails, tokens, raw prompts) and enforce it in code review.
- Version tagging: tag traces and errors with app version/commit SHA so you can correlate regressions to deploys.
- Runbooks: for each core alert, document “what to check first” and “how to mitigate.”
If your app includes AI outputs, the same discipline applies to citations and attribution. A helpful companion topic is multimodal citation hygiene for AI answers and brand mentions, which can reduce confusion when users rely on generated content.
How lovable.dev fits into observable React + Supabase delivery
When you build on a standard React + Supabase + Tailwind stack, you can apply mainstream observability practices without fighting proprietary constraints. That’s one reason teams use lovable.dev: you can iterate quickly with an AI builder while still keeping a codebase that supports conventional instrumentation, GitHub workflows, and production operations. The faster your iteration loop, the more you benefit from having tracing, query insights, and error budgets in place before the first serious traffic arrives.
Common failure modes and what “good telemetry” looks like
1) Slow pages with “no obvious backend issue”
Good telemetry shows a single trace where the frontend fetch is slow, the backend request is fine, and the delay is in a Postgres query segment. You can then reproduce the query, add an index, or reshape the access pattern.
2) Intermittent auth and RLS surprises
Good telemetry tags requests with auth state (without leaking PII) and captures the specific failure class: permission denied vs token refresh vs session mismatch. That saves hours of guessing when row-level security rules interact with new features.
3) “Works in staging” regressions after rapid iterations
Good telemetry ties errors to versions and deployments. If a change increases error budget burn right after a release, you know it’s not “random instability.” You roll back or patch quickly, then refine your instrumentation so it’s even clearer next time.
One operational takeaway
If you do only one thing, make the first production deploy emit end-to-end traces (browser to API to Postgres) and define one SLO for the most important user journey. That combination turns observability from “nice dashboards” into a decision tool.